Thursday, February 28, 2013

I've Been Plotting...

...to plot some plots! In Matlab!

Hello again. As alluded to in last week's post, I've been researching the stock market and its indices this week. In hopes of analyzing trends in index prices that might aid me in predicting their future, I've downloaded historical data for indices such as the Dow Jones Industrial Average and the Nasdaq Composite.

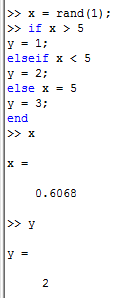
Also as promised, I've reunited with Matlab. Beyond programming and matrices, Matlab also has significant graphing and graph analysis capabilities. By converting the data I'd downloaded into text files, I was able to upload them into Matlab, where they could be graphed. Read ahead, and I'll show you how using Nasdaq Composite data as an example. :)

Before that, I'd like to start with a little background about the Nasdaq Composite. One of the most highly followed stock market indices in the United States, the Nasdaq Composite functions as an indicator of the performance of technology and growth companies. It includes common stocks and similar securities that appear on the NASDAQ stock market, amounting to over 3000 components. Its ticker symbol is IXIC.

Right then. Here's how I loaded its data into Matlab:


>> cd nasdaq
>> ls

.           ..          NASDAQ.txt

>> data=load('nasdaq.txt');

The historical data for the Nasdaq Composite appears in Matlab as a 248x1 matrix. I can then graph this data against time, t, with single day intervals, like so:


>> t=(1:248);
>> plot(t,data)
>> grid

and get the following figure:


Looking at the graph, it appears that Nasdaq Composite prices vary in a somewhat wavelike manner. Therefore, it might be analyzed as such. More about that in the next post!


Saturday, February 23, 2013

Darling, Let's Not See Each Other For A While


As you've probably noticed, I've spent the last several weeks working quite extensively with Matlab. In fact, I've been spending so much time with Matlab that I think the flames of our once passionate love have simmered and died away! Really, it's probably a good idea for Matlab and me to take a break from each other.

Don't get me wrong; we had a great run. I have learned many useful things and have had great fun playing around in Matlab, as evidenced by the previous post. It's just that I want to take a small break from the programming and mathematics to touch upon other subjects relevant to this project. And fear not! Matlab and I will surely be reunited. After all, I will be using him a lot more in the (near!) future. This separation is merely temporary. 

So what have I been doing during this brief hiatus? Well, I thought it would be a good idea to learn more about the data I will be analyzing. In other words, I’ve been reading a lot about the stock market and how it works. Though this knowledge may not be directly relevant to the analysis I’ll be doing, since that will mainly involve spotting and modeling trends, I do think it is worthwhile to have. Why not try to understand what the things I want to analyze actually are?

All right, that’s all I have for today.

See ya next week!

Thursday, February 21, 2013

Making Magic, Part Two

Hey! Lu here. Ready to pick up where we left off last week.

After long and grueling hours laboring alongside my father, I was able to devise a new program that can generate a 3x3 magic matrix in Matlab. Alright! Yay! This working program differs a bit from the failed one last week in approach, but more on that later. The real good news is that after the last several weeks, I'm now comfortable working in Matlab and have familiarized myself with the basic commands and structures I need to program in it. Why is this good news? Weelll, now I'm ready to move into the next part of my project! In the near future, I anticipate actually working with stock market prices. Then I'll be one step closer to creating my final model. So hold on tight everyone. The ride's only beginning. Whoo hoo!

Anyway, back to business. (Haha, see what I did there? Not funny? Ok.) As previously mentioned, this week's program doesn't start quite like last week's attempt. Instead of searching for any 3 non-repeating row vectors adding to 15 and generating a matrix, this program first lists the set of all combinations of 3 numbers between 1 and 9 that add to 15. Like so:


From that bit of code, I get the following:


mat =

     1     5     9
     1     6     8
     2     4     9
     2     5     8
     2     6     7
     3     4     8
     3     5     7
     4     5     6

Then, the program finds how many times each digit appears in the set of combinations:


generating:


rept =

     2     3     2     3     4     3     2     3     2

Now, you may be wondering why it's important to find out how many times each digit appears in the set of combinations adding to 15. Take a look at the magic matrix again:


Notice how the middle number must add in 4 ways in combination with other numbers to 15? Up, down, and twice diagonally. Now look at the corner numbers. They all have to add to 15 in 3 ways, right? By finding out how many times a digit appears in the set of combinations summing to 15, we can figure out which numbers have to go where in the magic matrix!

...Which is exactly what this program does:


and I get this matix:


mym =

     2     9     4
     7     5     3
     6     1     8


Now just to check. Do the rows, columns, and diagonals all add to fifteen? Yep, they sure do.

Tadaa!

Saturday, February 16, 2013

Making Magic, Part One

Hello all!

You might be wondering why I'm back so soon. No, it has nothing to do with the fact that I'm supposed to blog twice a week...Nope! Nothing at all. It's because I have some interesting developments to share! Read ahead to find out because I know you're simply dying to know. ;)

As I promised in the last post, I've been working on making the 3x3 magic square from scratch in Matlab. Matlab has this cool feature that allows you to write and save your own functions and programs as ".m" files that you can then run within the Matlab command window. So, to make my magic square algorithm, I'm writing these ".m" files.Guiding me with this process is my dear old dad, the resident Matlab expert. Here's what we've got so far.

In a file I've meaningfully dubbed "akfasld.m," the following is found:


I won't bore you with explanations of every line, but this is essentially a program that lists conditions for building a 3x3 matrix, "mat." Supposedly, akfasld should make a 3x3 magic matrix. Let's see what happens when I run it.

I get the following: mat =

     1     5     9
     2     6     7
     3     8     4

Hmm...
The rows all add up to 15 like they're supposed to, but what about the columns and diagonals? Oh snap. They don't add to 15 at all!

It appears I've managed to determine the row numbers that make the sum of each row 15, but I've neglected the orders in which the rows and the numbers within them should appear. Now I have to somehow shuffle the rows and their numbers around so that sums of the columns and diagonals equal the rows.

Err...I'll save that for next week.

Until then, have a nice weekend!

Friday, February 15, 2013

A Little Bit of Magic

Hi everyone! It's Lu again, back with another update.

Today, I'm going to talk a little about a piece of mathematical "magic."
Ladies and gentlemen, let me introduce...the 3x3 magic square.

Magic square of order 3.
Take a close look. What do each of the rows add up to? What about the columns? And the diagonals? They all add to 15! How magical.

An n-by-n magic square is defined as a matrix containing the integers from 1 to n^2 where each row, column, and the two diagonals all have the same sum. This sum, called the magic constant (M), is determined solely by n by this formula: M = \frac{n(n^2+1)}{2}. 
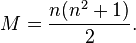
For the 3x3 square it is 15.

In Matlab, the command "magic(n)" generates a magic matrix when "n" is a scalar larger than or equal to 3.

For example,


>> X=magic(3)

X =

     8     1     6
     3     5     7
     4     9     2

To verify that X is indeed a magic square, I check the sums of its rows, columns, and diagonal:

>> sum(X)

ans =

    15    15    15

>> sum(X')'

ans =

    15
    15
    15

>> sum(diag(X))

ans =

    15

Tada! We have a magic square of order 3!

But how are such magic squares constructed? 
In the spirit of learning the in-and-outs of Matlab, I've been attempting to write an original program that constructs the 3x3 magic square. 

Be back with details on that soon!

Saturday, February 9, 2013

Programming Is What's Playing on TV, Right?

...Wait, you mean computer programming? Oh...


Well, I'll be the first to admit I didn't know a thing about programming. But, as it's necessary to know the basics of programming to get to know Matlab and ultimately use it to create predictive models, I decided to poke my head out of my shell of ignorance and learn a little about programming. 

So what is programming?

It's the process of scheduling shows on television.

Just kidding. We're talking about computer programming. 

Computer programming is the process of designing source codes (instructions) that tell a computer what to do. The source code is commonly written in some programming language. There are several types of programming languages. Matlab is an example of a high-level language. This means that programming in Matlab features a lot more abstraction from the machine language of the computer. High-level languages such as Matlab are easier to learn and use as they use more natural language elements and automate processes coded in low-level languages.

Here's an example of basic programming in Matlab:


As you can see, the Matlab language is not so far off from our own. Here, let me break it down, starting from the first line. 

"Assume x is a random 1x1 matrix between 0 and 1.
If x is greater than 5,
let y equal 1.
Or if x is less than 5,
let y equal 2.
Or if x equals 5,
let y equal 3.
That's all!

Pick an x value.
x equals 0.6068
So y equals 2."

Not too hard to understand, right?

Now compare that with an example of low-level programming language:

8B542408 83FA0077 06B80000 0000C383
FA027706 B8010000 00C353BB 01000000
B9010000 008D0419 83FA0376 078BD98B
C84AEBF1 5BC3


 .....What is that ugly mess? Boy, I'm sure glad I don't have to deal with that!

See you next time!

Thursday, February 7, 2013

A Lunch Date with Mr. Matlab

Hello all! It's been a little while. Here's an update on what I've been up to as of late.

Today I had a chicken wrap for lunch with -- you guessed it -- Matlab. Though the food was delicious, I admit the conversation was a little lacking. You see, Matlab is not a suave gentleman but a interactive computations and graphics program. Matlab's name stands for "matrix laboratory," and so, unsurprisingly, is especially proficient at matrix computations and manipulations. I've been spending the last few days exploring the basics of Matlab and familiarizing myself with its operations. I've discovered Matlab is somewhat like a glorified calculator. Both are used to solve mathematical problems and can be programmed to do specific things.

True to its name, Matlab's basic data element is the matrix array. Essentially, it computes everything as if it were in or part of a matrix. Addtionally, it solves problems numerically, not symbolically, which differentiates it from other programs such as Maple or Mathematica. Understanding this, I can begin to see the unique ways of using Matlab to solve problems.

For example, suppose I wish to graph the function y=f(x). If I set x to be a vector with linearly spaced entries, it can be regarded as a sort of one-dimensional grid that y can be graphed on. To do this, I simply set the array "x," then create "y" as another array whose values are the function of x's values.
To illustrate:
If I type the following into the command window,


>> x = (0:.05:2*pi);
>> y = cos(x);
>> plot(x,y)

I get the graph,


Pretty cool, right?


"Hold up, Lu!" you might be thinking. " What happened to all that whole spiel about predicting the future?" But don't worry. I haven't forgotten about about my hopes of predicting the stock market. Rather, before I attempt any such forecasts, I must first understand the program I'll be using to make predictive models: Matlab. Patience, everyone. One step at a time.